

Here’s the demo RDB ProNet Activity report written in partnership with Needlestack Consulting:
Some examples of our work
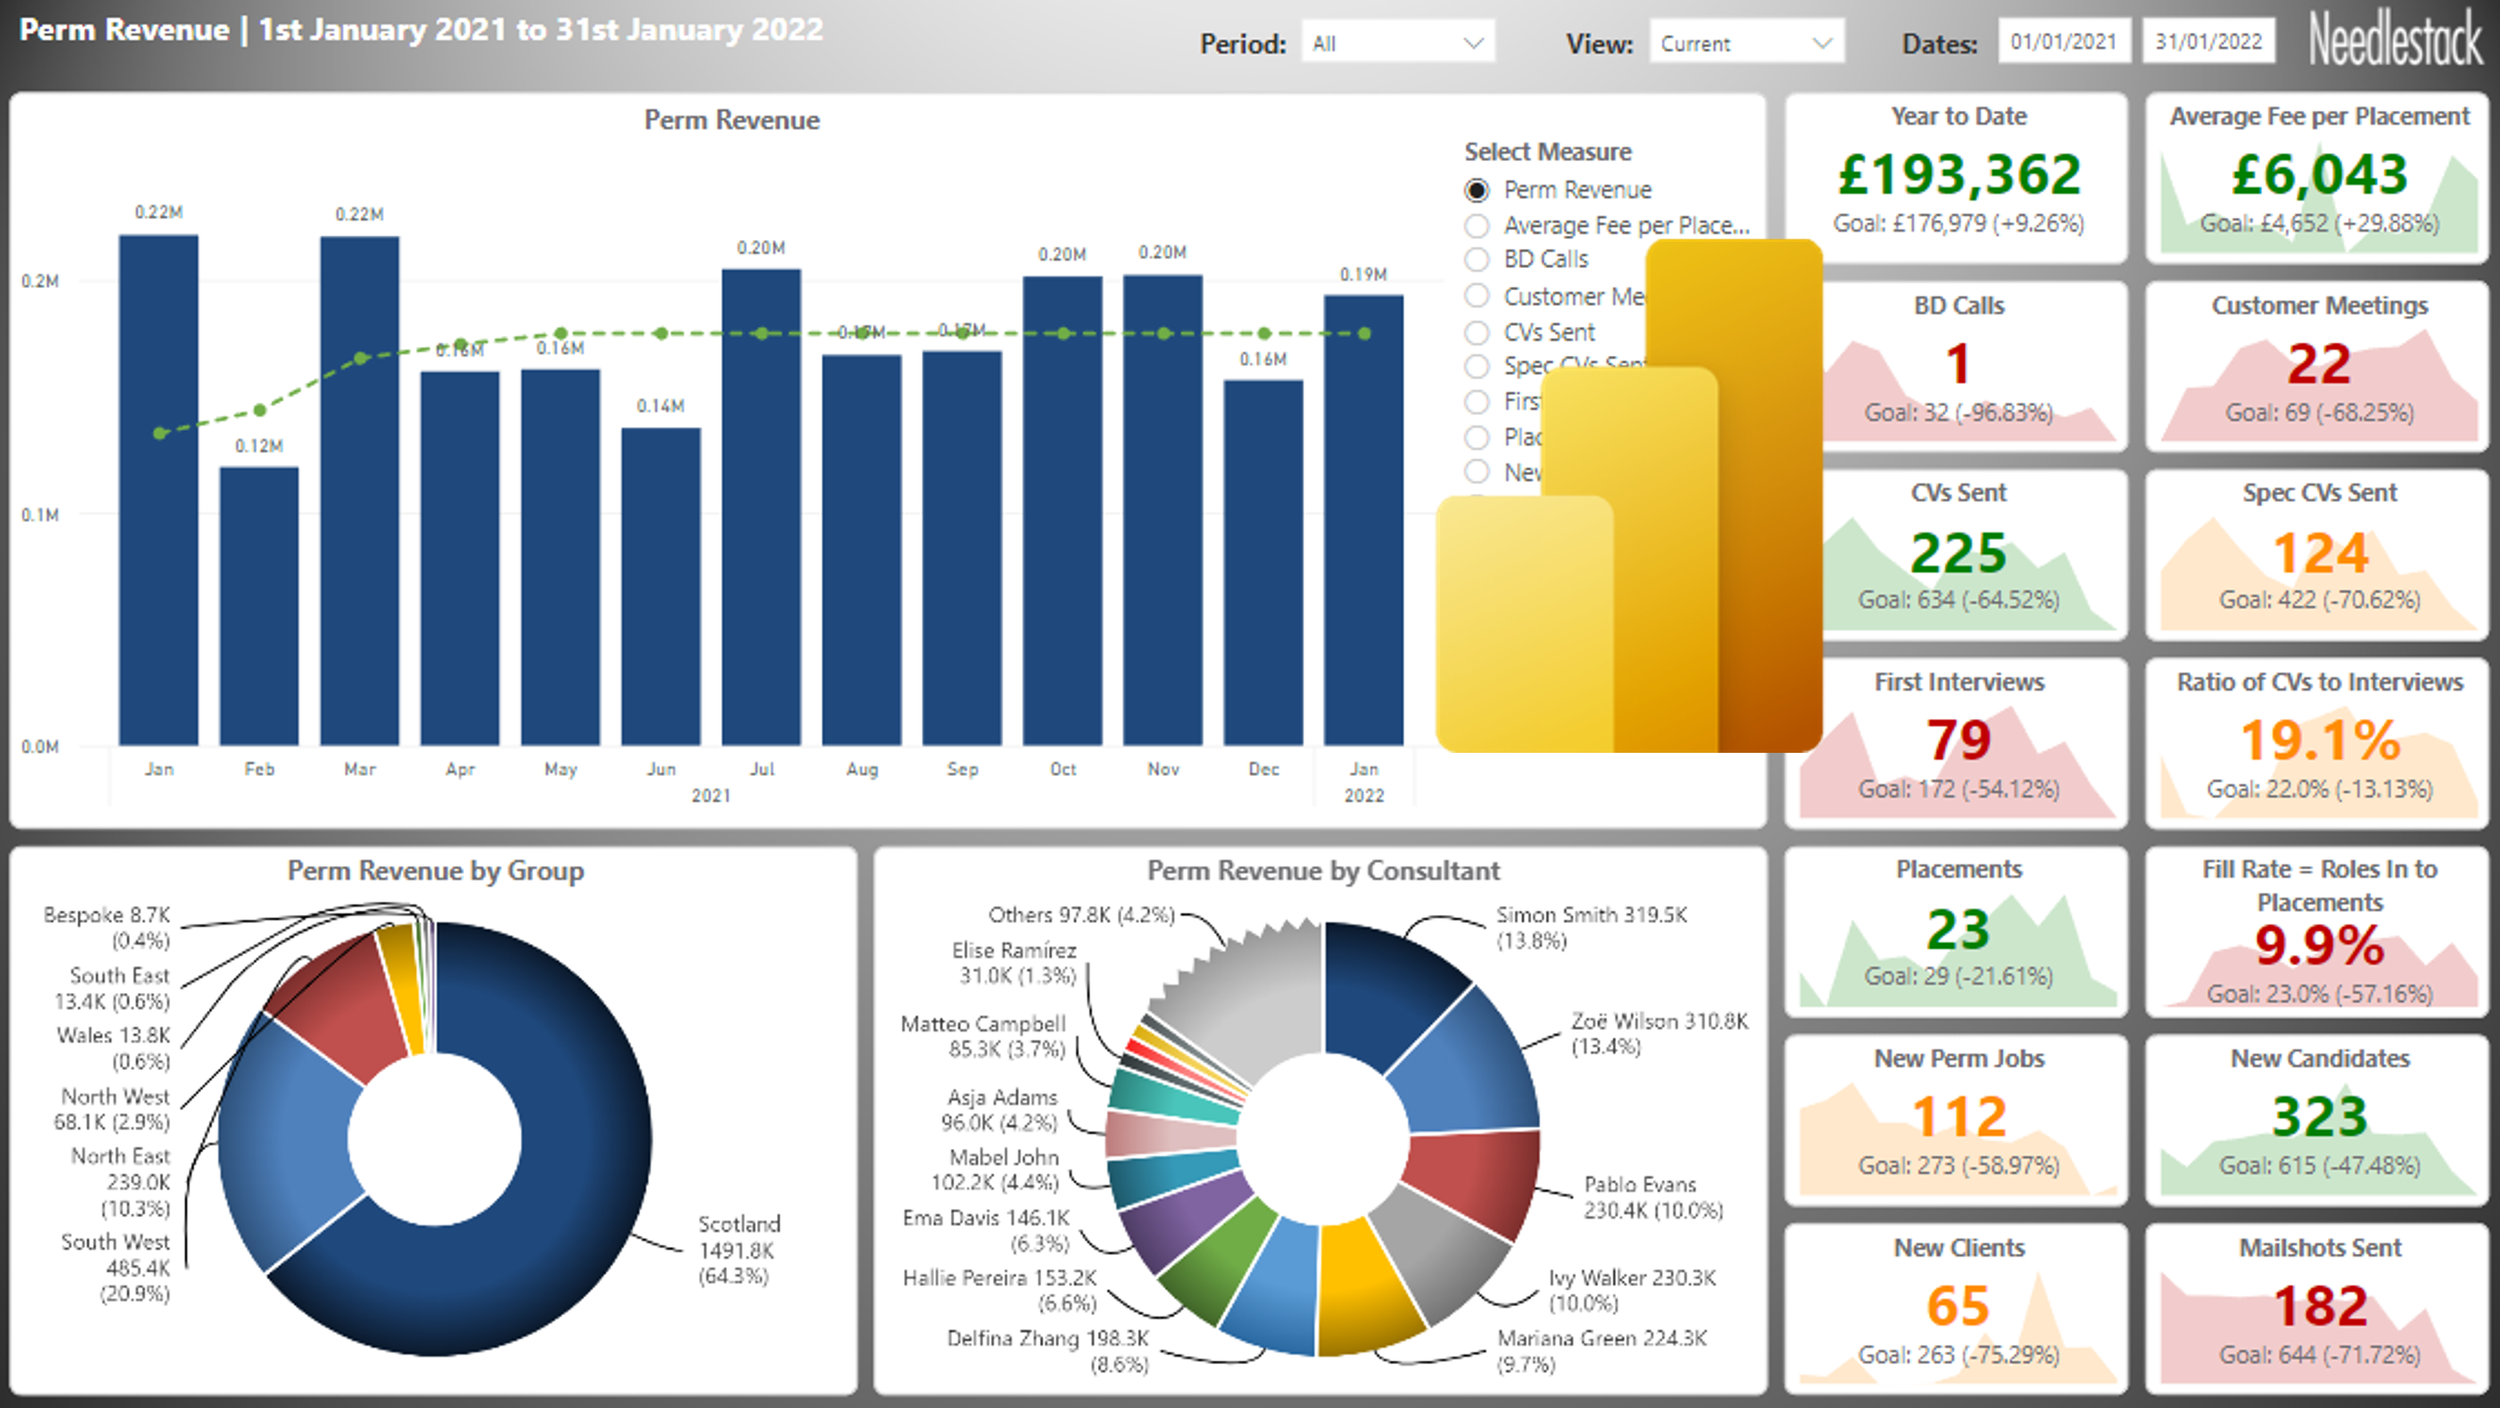
Here’s the demo RDB ProNet Activity report written in partnership with Needlestack Consulting:
This project takes a large amount of data and produces a compelling report that is easy to understand whilst still allowing complex comparisons and detail drill-down.
It illustrates the use of additional reference data that is essential for meaningful reports, and how to ensure it is in synch with the main dataset.
It features a particularly good use of area charts to illustrate the cumulative effect of energy use reduction over time.
A Power BI report built for a recruitment company summarising the movement of people between companies, sectors, geography and levels of seniority.
The solution required fuzzy matching with Excel, an additional reference data sheet, a bespoke word matching function in Power Query and an advanced technique to read the contents of a SharePoint folder. It also features a couple of really cool Chord charts.
A performance dashboard built for a UK Loans Intermediary company using Power BI and shared via the Power BI Service and SharePoint.
It features extensive data transformation with Power Query and a particularly successful customer activity heatmap. Although the DAX measures are not complicated there are 66 of them and USERELATIONSHIP is used extensively to manage the 7 connections between the Fact and Calendar tables.
An IT Service Management (ITSM) Dashboard built for a global investment bank using Microsoft Excel and VBA to report on SLA and KPI performance.
It used a large data set of 92 data fields to calculate 4 SLAs, 14 KPIs and 46 measures, presented in a variety of graphs and blocks. There were 23 filters enabling the user to interrogate the data and isolate the cause of any issue.
A Project Portfolio Management and Workflow application built for a global pharmaceuticals company using Microsoft Excel with VBA and delivered via SharePoint.
This one is incredibly complicated and specific, and demonstrates just how much is possible with Excel and VBA.
A financial management solution written for a local church to manage a particular set of accounts receivable and payable. The solution was based on Excel VBA and User Forms and featured: extensive VBA code to enforce the process and validate input
There are lots of good accounting packages out there and we don't recommend managing all of your accounts with Excel, but there are occasions when a spreadsheet is the most cost-effective solution to some of your finance challenges.
An outage impact calculation system built for a UK Insurance company using Microsoft Excel. The solution included a user-driven model front-end and calculations from detailed application performance data extracted from a dedicated, third party system.
In this example, an Excel spreadsheet model is used to turn technical data into important business information.
A resource tracking and forecasting system built for a global IT outsource company using Microsoft Excel and VBA, delivered via SharePoint. The solution included dynamic filtering to control user input forms, conditional format icons and graphs of actuals and forecast versus budget.
This spreadsheet shows how complicated requirements and processes can be boiled down into a tool that is relatively easy to use.
An IT Service Management (ITSM) dashboard built for an international Commercial Insurance Company using Microsoft Excel and VBA code. The solution took data from the client’s ITSM ticket system, calculated performance against SLAs and presented the results in a dynamic dashboard.
A vacation and training tracker system built for a global IT outsourcing company using Microsoft Excel and delivered via SharePoint. The solution included a data entry sheet, a calendar display and a tracking report.
This is a simple worksheet that is easy to use and support, and has an elegant look and feel.
A budget tracking system built for a large UK Insurance company using Microsoft Excel. The solution included combination graphs, conditional formatting and icons.
A team or department budget typically has a number of components, and understanding how each is performing can be difficult.
An asset ageing and replacement system built for a large UK Insurance company using Excel. The solution included a replacement model based on asset age used to create seven year CapEx and Depreciation Budgets and Ageing Summary reports.
This solution demonstrates how a number of modelling tables, combined with purchase information can be used to create accurate year on year budgets.
A task planning and scheduling system built for a UK financial services company using Microsoft Excel VBA. The solution included calendar display, data entry form, search and help facilities. It was more than just a shared calendar: it used a library of information about tasks to calculate the likely time required and managed scheduling conflicts.
It illustrates a situation where the very implementation of a tool forces adherence to a process, thereby driving consistency and savings.
A Service Level Agreement (SLA) reporting system built for an outsourced service provider using Microsoft Excel. The solution included extensive conditional formatting to highlight SLA breaches and VBA code to perform complex calculations.
Although the design is very traditional – old fashioned even – it is a prime example of Excel being used to bridge the gap between a system’s capabilities and the users’ requirements.
A staff resource tracking system built for a large multi-national bank using Microsoft Excel and VBA. The solution included details required by a number of different departments and a facility to create organisation chart data that could be uploaded into Microsoft Visio.
This example serves to illustrate that significant time savings and data quality improvements can be made with quite simple Excel projects.


